 爱站程序员基地
nagios简介
一、使用Nagios的必要性
1、大量的IT基础设施系统管理繁琐、复杂。
2、减少管理和维护成本
3、优化系统、合理利用服务资源
监控软件局限性:
1、没有任何工具可以监视您所需的一切内容。
2、要让工具完全适应您的需求需要做许多自定义工作。
二、 什么是Nagios
Nagios—Nagios Ain’t Gonna Insist on Sainthood
最初项目名字是NetSaint,程序主体由ANSI C编制.
Nagios是一款开源的免费网络监视工具,其功能强大,灵活性强。能有效监控Windows、Linux和Unix的主机状态,交换机、路由器等网络设置,打印机等,在系统或服务状态异常时发出邮件或短信报警第一时间通知网站运维人员,在状态恢复后发出正常的邮件或短信通知。
三、Nagios的结构
Nagios 可分为核心和插件两个部分。
Nagios 的核心部分只提供了很少的监控功能,因此要搭建一个完善的IT监控管理系统,用户还需要给Nagios安装相应的插件,插件可以从Nagios官方网站下载,也可以根据实际要求自己编写所需的插件。
Nagios必须运行在linux/Unix平台下,需要gcc编译器支持,nagios还提供了一个web监控界面。
四、 Nagios可实现的功能
(1)监视本地或者远程主机资源 (内存、进程、磁盘等)
(2)监视网络服务资源 (HTTP、PING、FTP、SMTP、POP3等)
(3)允许用户编写自己的插件来监控特定的服务。
(4)当被监控对象出现异常时,可以通过邮件、短信等方式通知管理人员。
(5)可以事先定义事件处理程序,当主机或者服务出现故障时自动调用指定的处理程序。
(6)可以通过web界面来监控各个主机或服务的运行状态。
安装教程
一、环境搭建
主节点:192.168.56.130
从节点:192.168.56.131
iptables和selinux关闭
二、安装准备
1、依赖包检测
rpm -q gcc glibc glibc-devel gd gd-devel openssl-devel xinetd
2、下载相应的软件包
php apache nagios nagios-plugins nrpe
3、创建用户和用户组
useradd nagios -d /home/nagios
4、软件安装位置
nagios /usr/local/nagios/
apache /usr/local/apache
php /usr/local/apache/axps
三、安装编译
1、主节点编译
apache安装
.
/configure
--prefix=
/usr/local/apache2
make
&&
make
install
php安装
.
/configure
--prefix=
/usr/local/apache2/axps
make && make install
nagios安装
./configure –prefix=/usr/local/nagios
make
all
make
install
&&
make
install
-init&&
make
install
-commandmode&&
make
install
-config&& make install-webconf && make install-exfoliation && make install-classicui
nagios-plugins安装
./configure –prefix=/usr/local/nagios –with-nagios-user=nagios –with-nagios-group=nagios
make && make install
nrpe安装
./configure
make all && make install-plugin
为网页登录设置密码和用户名
管理员用户名有效命名看nagios/etc/cgi.cfg里的
default_user_name=nagioaadmin选项,也可以在这里新增管理用户
具体密码存放文件名看/etc/httpd/conf.d/nagios.conf里的
AuthUserFile /usr/local/nagios/etc/htpasswd.users选项
密码设置
htpasswd -c /usr/local/nagios/etc/htpasswd.users nagiosadmin
密码自定义
2、从节点编译
nagios-plugins安装
./configure –prefix=/usr/local/nagios –with-nagios-user=nagios –with-nagios-group=nagios
make && make install
nrpe安装
./configure????????
make all && make install-plugin&&make install-daemon && make install-daemon-config && make install-xinetd
三、主节点配置
1、配置文件说明
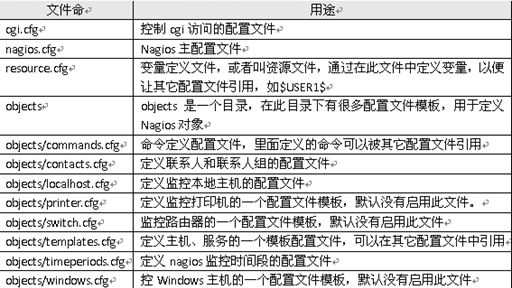
2、nagios.cfg配置文件
为了方便管理,取消了单个配置文件指定,采用配置存放目录方式进行管理
定义配置文件目录,取消单个配置文件路径。
3、定义监控模块配置文件
vi /usr/local/nagios/etc/templates/weblates.cfg
- define contact{
- name web-contact ; 这是联系人模块名字
- service_notification_period 24×7 ; 服务通知可以随时发送
- host_notification_period 24×7 ; 主机通知可以随时发送
- service_notification_options w,u,c,r,f,s ; send notifications for all service states, flapping events, and scheduled downtime events
- host_notification_options d,u,r,f,s ; send notifications for all host states, flapping events, and scheduled downtime events
- service_notification_commands notify-service-by-email ; 通过电子邮件发送服务通知
- host_notification_commands notify-host-by-email ; 通过电子邮件发送主机通知
- register 0 ; DONT REGISTER THIS DEFINITION – ITS NOT A REAL CONTACT, JUST A TEMPLATE!
- }
- define host{
- name web-host ; 该主机模板的名称
- notifications_enabled 1 ; 主机启用通知
- event_handler_enabled 1 ; 主机事件处理程序已启用
- flap_detection_enabled 1 ; 启用瓣检测
- process_perf_data 1 ; 处理性能数据
- retain_status_information 1 ; 保留跨程序重新启动状态信息
- retain_nonstatus_information 1 ; 保留跨程序重新启动无身份信息
- notification_period 24×7 ; 主机全天候随时发送的通知
- register 0 ; DONT REGISTER THIS DEFINITION – ITS NOT A REAL HOST, JUST A TEMPLATE!
- }
- define host{
- name linux-web-server ;该主机模板的名称
- use web-host ; 这个模板继承了通用主机模板其他值
- check_period 24×7 ; 全天候;默认情况下,Linux主机进行检查日以继夜
- check_interval 5 ; 积极检查主机每隔5分钟
- retry_interval 1 ; 附表主机检查重试间隔为1分钟
- max_check_attempts 10 ; 检查每个Linux主机10倍(最大)
- check_command check-host-alive ; 默认命令检查Linux主机存活
- notification_period workhours ;Linux的管理员讨厌被吵醒了,所以我们只在白天通知
- ; 需要注意的是notification_period变量被从覆盖
- ; 这是从一般的主机模板继承了价值!
- notification_interval 2 ; 重发通知,每隔2小时
- notification_options d,u,r ; 只发送特定的主机状态通知
- contact_groups websadmin ; 通知被发送到管理员默认联系人
- register 0 ; DONT REGISTER THIS DEFINITION – ITS NOT A REAL HOST, JUST A TEMPLATE!
- }
- define service{
- name generic-web-service ; 该服务模板的\’名字\’
- active_checks_enabled 1 ; 现役检查启用
- passive_checks_enabled 1 ; 被动式服务检查启用/接受
- parallelize_check 1 ; 主动服务检查应并行(禁用这可能导致重大的性能问题)
- obsess_over_service 1 ; 我们应该迷恋这项服务(如有必要)
- check_freshness 0 ; 默认是不检查服务\’新鲜感\’
- notifications_enabled 1 ; 服务启用通知
- event_handler_enabled 1 ; 服务事件处理程序已启用
- flap_detection_enabled 1 ; 启用瓣检测
- process_perf_data 1 ; 处理性能数据
- retain_status_information 1 ; 保留跨程序重新启动状态信息
- retain_nonstatus_information 1 ; 保留跨程序重新启动无身份信息
- is_volatile 0 ; 该服务是不挥发
- check_period 24×7 ; 全天候;该服务可以在一天中的任何时间进行检查
- max_check_attempts 3 ; 重新检查服务最多3次,以确定其最终(硬)状态
- normal_check_interval 3 ; 检查服务在正常条件下,每10分钟
- retry_check_interval 2 ; 重新检查服务每两分钟,直到硬状态可以被确定
- contact_groups websadmin ; 通知被发送出去给大家的“管理员”组
- notification_options w,u,c,r ; 发送通知警告(warning),未知的(unknown),关键的(critical),和恢复活动(recovery events)
- notification_interval 4 ; 再通知有关每隔4小时服务问题
- notification_period 24×7 ; 全天候;通知可以被发送出去,在任何时间
- register 0 ; DONT REGISTER THIS DEFINITION – ITS NOT A REAL SERVICE, JUST A TEMPLATE!
- }
- define service{
- name web-service ; 该服务模板的\’名字
- use generic-web-service ; 使用通用 – 网络服务;从一般服务定义继承默认值
- max_check_attempts 4 ; 重新检查服务高达4倍,以确定其最终(硬)状态
- normal_check_interval 2 ; 检查服务在正常条件下,每5分钟
- retry_check_interval 1 ; 重新检查服务每分钟,直到硬状态可以被确定
- register 0 ; DONT REGISTER THIS DEFINITION – ITS NOT A REAL SERVICE, JUST A TEMPLATE!
- }
3、定义监控主机和主机组
- vi /usr/local/nagios/etc/hosts/webs.cfg
- define host{
- use linux-web-server
- host_name web
- alias web-1
- address 192.168.56.131
- }
- define host{
- use linux-web-server
- host_name wab2
- alias web-2
- address 192.168.56.132
- }
- define hostgroup{
- hostgroup_name webs
- alias webs
- members web,web2
- }
将web和web2的主机加入监控组
4、定义联系人和联系组
vi /usr/local/nagios/etc/contacts/web_contacts.cfg
- define contact{
- contact_name webadmin
- alias webs Admin
- use web-contact
- email [email protected]
- }
- define contactgroup{
- contactgroup_name websadmin
- alias websgroup
- members webadmin
- }
5、命令监控命令
因为要监控远程主机,需要用到check_nrpe这个命令,所以需要定义后才可以使用
vi /usr/local/nagios/etc/commands/commands.cfg
- define command{
- command_name check_nrpe
- command_line $USER1$/check_nrpe -H $HOSTADDRESS$ -t 30 -c $ARG1$
- }
- define command{
- command_name check_nrpe_args
- command_line $USER1$/check_nrpe -H $HOSTADDRESS$ -t 30 -c $ARG1$ -a $ARG2$
- }
5、定义监控sever配置
这个是定义远程主机(从节点)的,如果是本地主机(主节点)就把参照localhost.cfg配置文件
vi /usr/local/nagios/etc/server/web_server.cfg
define service{
use web-service ; Name of service template to use
host_name web
service_description PING
check_command check_ping!100.0,20%!500.0,60%
}
define service{
use web-service
host_name web
service_description Root Partition
check_command check_nrpe_args!check_disk!20% 10% /
}
define service{
use web-service ; Name of service template to use
host_name web
service_description Current Users
check_command check_nrpe_args!check_users!20 50
}
define service{
use web-service ; Name of service template to use
host_name web
service_description Total Processes
check_command check_nrpe_args!check_procs!250 400 RSZDT
}
define service{
use web-service ; Name of service template to use
host_name web
service_description Current Load
check_command check_nrpe_args!check_load!5.0,4.0,3.0 10.0,6.0,4.0
}
define service{
use web-service ; Name of service template to use
host_name web
service_description Swap Usage
check_command check_nrpe_args!check_swap!20 10
}
define service{
use web-service ; Name of service template to use
host_name web
service_description SSH
check_command check_ssh
notifications_enabled 0
}
附上别人的配置文件图:
5_}][U}CT3L~O.gif)
四.Nrpe详解
1.先用表格列举一下我的监控对象和阀值:
| 监控对象 | 监控阀值 | |
| 主机资源 | 主机存活:check_ping | -w 3000.0,80% -c 5000.0,100% -p 5(3000毫秒响应时间内,丢包率超过80%报警告,5000毫秒响应时间内,丢包率超过100%报危急,一共发送5个包) |
| 登录用户:check_user | -w 5 -c 10(w为警告,c为危急) | |
| 系统负载:check_load | -w 15,10,5 -c 30,25,20(1分钟,5分钟,15分钟大于对应的等待进程数则警告或危急) | |
| 磁盘占用率:check_disk | -w 20% -c 10% -p /(根分区剩余空间为总大小的20%警告,10%危急,-p后是根分区) | |
| 脚本检测磁盘I/O:check_iostat | -w 5 –c 10 (磁盘I/O的iowait超过5%报警告,超过10%报危急) | |
| 检测僵尸进程:check_zombie _procs | -w 5 -c 10 -s Z(有5个僵尸进程报警告,10个报危急) | |
| 检测总进程数:check_total_procs | -w 150 -c 200(总进程到150个警告,200个报危急) | |
| 脚本检测内存剩余:check_mem | -w 90% -c 95%(内存空闲率90%以上报警告,95%以上报危急) | |
| 检测交换分区使用率:check_swap | -w 20% -c 10%(交换分区剩余空间为总大小的20%警告,10%危急) | |
| 应用服务监控 | 监控服务端口:check_tcp | -H localhost2 -p 80(主机与对应的端口号) |
| 监控页面响应时间:check_http | -H localhost2 -u http:\\/\\/localhost2/test.jsp –w 5 –c 10(检查页面,超过5s报警告,超过10s报危急) | |
| 脚本检测IP连接数:check_ips | -w 200 –c 250(IP连接数超过200报警告,超过250报危急) | |
| 流量监控 | 监控server流量:Check_traffic | -V 2c -C public -H localhost2 -I 2 -w 12,30 -c 15,35 -M –b(snmp版本,用户,主机,对应网卡,警告阀值,危急阀值) |
五、从节点配置1、配置nrpe文件vi /usr/local/nagios/etc/nrpe.cfg
- log_facility=daemon
- pid_file=/var/run/nrpe.pid
- server_port=5666
- nrpe_user=nagios
- nrpe_group=nagios
- allowed_hosts=192.168.56.130
- dont_blame_nrpe=1
- allow_bash_command_substitution=0
- debug=0
- command_timeout=60
- connection_timeout=300
- command[check_users]=/usr/local/nagios//libexec/check_users -w $ARG1$ -c $ARG2$
- command[check_load]=/usr/local/nagios//libexec/check_load -w $ARG1$ -c $ARG2$
- command[check_hda1]=/usr/local/nagios//libexec/check_disk -w $ARG1$ -c $ARG2$ -p $ARG3$
- command[check_zombie_procs]=/usr/local/nagios//libexec/check_procs -w $ARG1$ -c $ARG2$ -s $ARG3$
- command[check_total_procs]=/usr/local/nagios//libexec/check_procs -w $ARG1$ -c $ARG2$
- command[check_users]=/usr/local/nagios//libexec/check_users -w $ARG1$ -c $ARG2$
- command[check_load]=/usr/local/nagios//libexec/check_load -w $ARG1$ -c $ARG2$
- command[check_disk]=/usr/local/nagios//libexec/check_disk -w $ARG1$ -c $ARG2$ -p $ARG3$
- command[check_procs]=/usr/local/nagios//libexec/check_procs -w $ARG1$ -c $ARG2$ -s $ARG3$
- command[check_swap]=/usr/local/nagios//libexec/check_swap -w $ARG1$ -c $ARG2$
- command[check_ping]=/usr/local/nagios//libexec/check_ping -w $ARG1$ -c $ARG2$
由于硬盘、swap监控需要开启dont_blame_nrpe选项,把它设为1才可以监控硬盘等。
2、运行nrpe守护进程
/usr/local/nagios/bin/nrpe -c /usr/local/nagios/bin/nrpe.cfg -d
在重启xinetd服务: service xinetd restart
3、将nrpe加入系统服务,方便关闭和开启服务
vi /etc/init.d/nrpe
- #!/bin/bash
- #nrpe server startscript
- PATH=$PATH
- prog=nrpes
- pidfile=${PIDFILE-/var/run/nrpe.pid}
- lockfile=${LOCKFILE-/var/lock/subsys/nrpe}
- npre_home=/usr/local/nagios/bin/
- start_script=$npre_home/nrpestart.sh
- stop_script=$npre_home/nrpestop.sh
- start(){
- echo -n $"Starting $prog:"
- cd $npre_home
- bash $start_script
- RETVAL=$?
- echo
- [ $RETVAL = 0 ] && touch ${lockfile}
- return $RETVAL
- }
- stop(){
- echo -n $"Stoping $prog:"
- cd $npre_home
- bash $stop_script
- RETVAL=$?
- echo
- [ $RETVAL =0 ] && rm -f ${lockfile} ${pidfile}
- }
- case "$1" in
- start)
- start
- ;;
- stop)
- stop
- ;;
- restart)
- stop
- start
- ;;
- *)
- echo $"Usage: $prog {start|stop|restart}"
- exit 1
- esac
- exit $RETVAL
vi /usr/local/nagios/bin/nrpestart.sh
- #!/bin/bash
- #start_script
- PATH=$PATH
- command_nrpe=/usr/local/nagios/bin/./nrpe
- cfg=/usr/local/nagios/etc/nrpe.cfg
- $command_nrpe -c $cfg -d
vi /usr/local/nagios/bin/nrpestop.sh
- #!/bin/bash
- #start_script
- PATH=$PATH
- pid=`ps -ef | grep nrpe | grep -v grep | awk \'{printf $2 "\\n"}\’`
- kill $pid
- 点赞
- 收藏
- 分享
- 文章举报

 冰海破封发布了1 篇原创文章 · 获赞 0 · 访问量 242私信关注