matplotlib画条形图
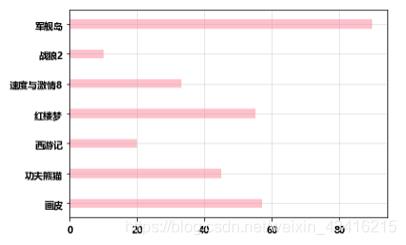
画横着的条形图
from matplotlib import pyplot as pltimport matplotlibfont ={\'family\':\'MicroSoft YaHei\'} #win可以显示中文matplotlib.rc(\"font\",**font)a=[\"画皮\",\"功夫熊猫\",\"西游记\",\"红楼梦\",\"速度与激情8\",\"战狼2\",\"军舰岛\"]b=[57.01, 45, 19.89, 55.21, 33.21, 10.08, 89.80]#绘制竖着的条形图plt.bar(range(len(a)),b,width=0.3)#width为条形图的宽度#设置x轴plt.xticks(range(len(a)),a,rotation=90)plt.show()
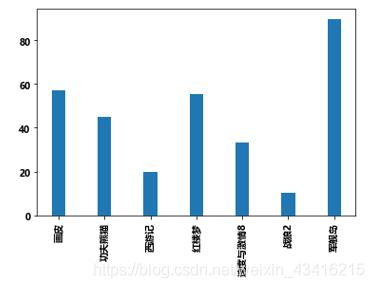
画竖着的条形图
from matplotlib import pyplot as pltimport matplotlibfont ={\'family\':\'MicroSoft YaHei\'} #win可以显示中文matplotlib.rc(\"font\",**font)a=[\"画皮\",\"功夫熊猫\",\"西游记\",\"红楼梦\",\"速度与激情8\",\"战狼2\",\"军舰岛\"]b=[57.01, 45, 19.89, 55.21, 33.21, 10.08, 89.80]#绘制横着的条形图plt.barh(range(len(a)),b,height=0.3,color=\"pink\")#height为条形图的宽度#设置y轴plt.yticks(range(len(a)),a)#设置网格plt.grid(alpha=0.4)plt.show()
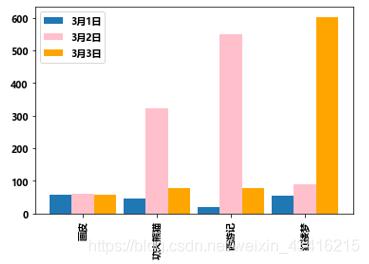
画多次条形图
from matplotlib import pyplot as pltimport matplotlibfont ={\'family\':\'MicroSoft YaHei\'} #win可以显示中文matplotlib.rc(\"font\",**font)a=[\"画皮\",\"功夫熊猫\",\"西游记\",\"红楼梦\"]b=[57,45,19,55]b2=[60,323,549,89]b3=[59,79,78,603]#绘制竖着的条形图bar_width =0.3#条形图右移,使之不重叠x_b=list(range(len(a)))x_b2=[i+bar_width for i in x_b]x_b3=[i+bar_width*2 for i in x_b]plt.bar(x_b,b,width=bar_width,label=\"3月1日\")#width为条形图的宽度plt.bar(x_b2,b2,width=bar_width,label=\"3月2日\",color=\"pink\")plt.bar(x_b3,b3,width=bar_width,label=\"3月3日\",color=\"orange\")#设置图例plt.legend()#设置x轴plt.xticks(x_b2,a,rotation=90) #x轴对齐b2的数据plt.show()
 爱站程序员基地