import numpy as npimport matplotlib .pyplot as pltimport pandas as pdfrom pandas import Series,DataFrame# 处理中文正常显示plt.rcParams[\'font.sans-serif\'] = [\'FangSong\']# 处理负号显示plt.rcParams[\'axes.unicode_minus\']=False
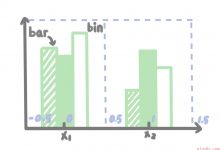
柱状图
# 取出一张纸plt.figure(1)# plt.subplot( x,y,z) x行y列的z号位置ax1=plt.subplot(1,1,1)y_data=[15,20,18,25]x_data=np.arange(4)# 画图返回四个柱子rect=ax1.bar(x_data,y_data,width=0.5,color=\'#93ccd3\')for each in rect:# 获取自身的左下角坐标x=each.get_x()# 获取y轴值height=each.get_height()\'\'\'ax.text(x,y,str) 写一个文本x,y默认为0\'\'\'ax1.text(x+0.15,height+0.3,f\'{height}W\')ax1.set_xticks(x_data)ax1.set_xticklabels([f\'第{each}季度\' for each in list(\'一二三四\')])ax1.set_ylim(0,30)# 网格显示ax1.grid()ax1.set_ylabel(\'销量(单位:万件)\')ax1.set_title(\'xxx2020年销售季度统计\')plt.show()

一个画布多个图
plt.figure(figsize=(12,8))ax2=plt.subplot(2,2,1)ax2.plot([1,2,3],[1,2,3])ax3=plt.subplot(2,2,2)ax3.bar([1,2,3],[1,2,3])ax4=plt.subplot(2,2,3)ax4.pie([1,2,3])ax5=plt.subplot(2,2,4)ax5.scatter([1,2,3],[1,2,3])
<matplotlib.collections.PathCollection at 0x207d15e90b8>
plt.figure(2)plt.subplot(1,2,1)plt.plot([1,2,3],[2,1,3])plt.subplot(1,2,2)plt.bar([1,2,3],[2,1,3])
<BarContainer object of 3 artists>
pandas 对象 直接使用画图函数
s=Series(np.random.randn(10))s.plot()
AxesSubplot:
s.plot(kind=\'bar\')
AxesSubplot:
s.plot(kind=\'barh\')
AxesSubplot:
s2=Series(np.random.randn(10),index=list(\'abcdefghij\'))s2.plot()
AxesSubplot:
Series([1,2,3,4],index=list(\'abcd\')).plot(kind=\'pie\')
AxesSubplot:ylabel=‘None’
df=DataFrame(np.random.randint(1,10,(4,5)),index=list(\'abcd\'),columns=list(\'一二三四五\'))df
一 二 三 四 五a 6 6 9 7 8b 4 9 7 1 1c 9 8 9 5 3d 9 5 5 8 2
df.plot(kind=\'line\')plt.show()

 爱站程序员基地


